Case Studies
We have prepared several case studies, an Analysis Report and the TreeRadar brochure to better present an in-depth explanation of the TRU system and the benefits it offers the tree care specialist.
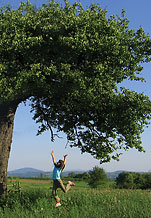
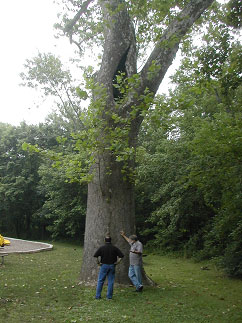
Trunk Inspection of an Oak with Significant Decay
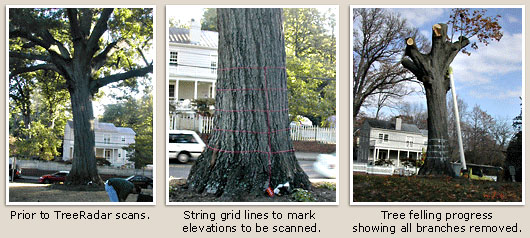
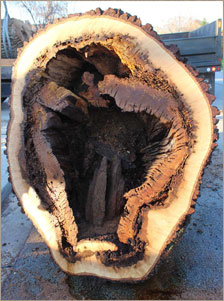 Robert Booty of San Jose's Arborist OnSite inspected this particular tree which, like most Oaks, was a a challenge to scan because Oaks tend to have very bumpy trunks that necessitate “sector” scans, i.e., scanning around these bumpy areas. It was clear that the trunk was compromised since the missing branch about 20’ high (shown in the 2nd slide) clearly showed decay but it was unknown what the extent of this was at various other elevations in the trunk.
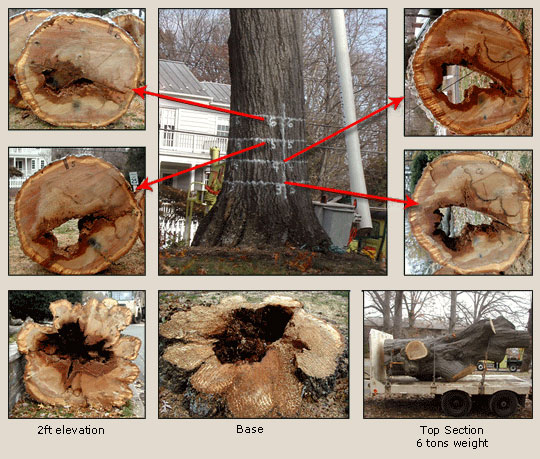
The scan showed that the trunk was severely decayed with only about 7” of solid wood left throughout the entire periphery at all elevations scanned and, quite likely, throughout the entire trunk’s length. In other words, it was a hollow shell. The recommendation was made to take the tree down.The tree company that felled it was instructed to make cuts at the red painted horizontal stripes that showed the various elevations where a scan took place.
Click Here to View the Scan Details and Photos, and see how the radar results very accurately predicted the internal trunk decay.
Root Inspection Procedure for Generating a Root Morphology Map
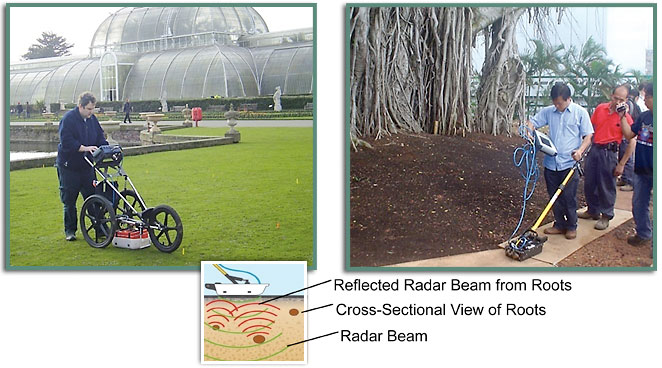
Root Inspection Procedure
Scan over either Bare Surface (soil, grass) or Covered Surface (brick, concrete, paving, asphalt). Choose an antenna with the right resolution/depth characteristic.
| Smallest Detectable Root Diameter: 1cm (0.4in) with 900MHz antenna 2cm (0.8in) with 400MHz antenna |
Scan depths to: 1m (3ft) using 900MHz antenna 3m (9ft) using 400MHz antenna |
Objectives...
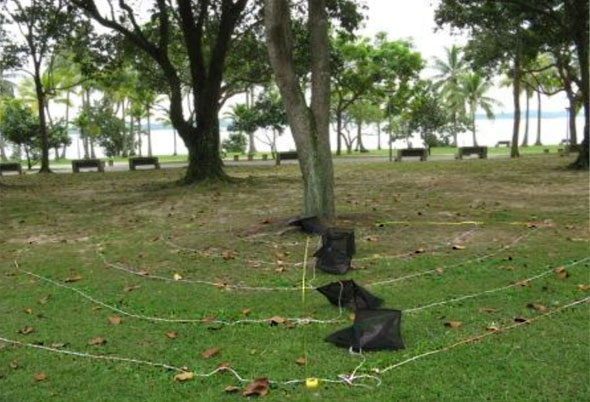
- Set GPR scan lines in the area around a tree
- Scan with GPR system – either covered (concrete, asphalt, brick, pavers) or bare surfaces – to detect root reflections
- Connect the reflections (“hits”) found on each scan line with succeeding scan lines to create a 3D Root Morphology Map
- Create a Root Surface Density Map to show Root layout and density
Here are the steps...
Step 1:
Prepare a Root Scan Layout
Step 2:
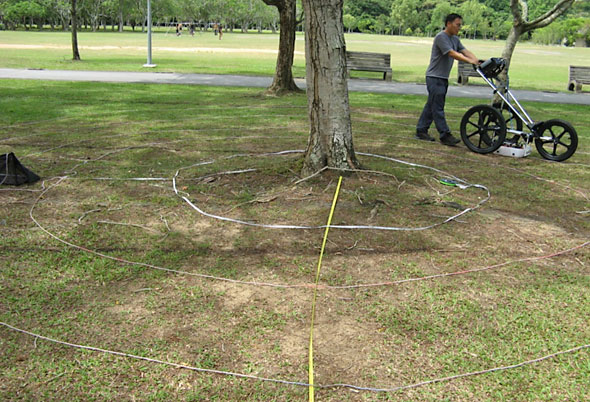
Create a Rough Grid to Implement
the Root Scan Layout
Step 3:
Scan each Grid Line using Ground-Penetrating
Radar (GPR) with Data Acquisition Triggered by
a Distance-Encoding Wheel
Step 4:
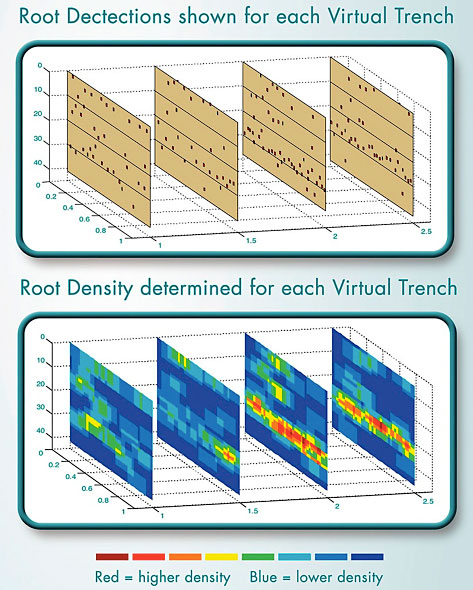
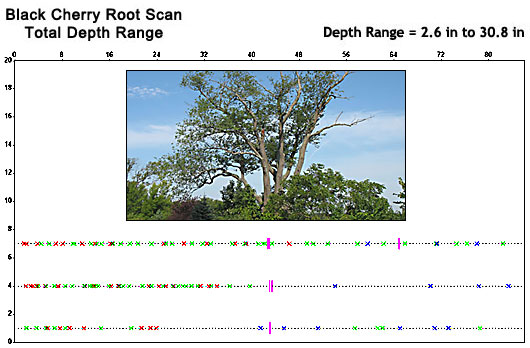
Process each Scan Line to create a 2D “Virtual Trench” map showing X (distance along scan line) & Y (depth) coordinates of each Root Detection (dots)
Step 5:
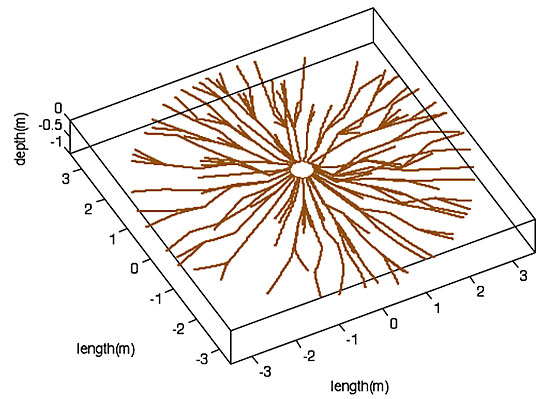
Create a 3D Root Morphology map (“Virtual Excavation”) by algorithmically connecting the detected roots found on each Scan Line
Step 6:
Process the 3D Root Morphology map to create a Surface Density Map
Summary...
- Tree Roots can be Detected and Mapped accurately, as confirmed by test excavations, using Non-Invasive Ground Penetrating Radar
- Soils that are generally considered hostile to GPR - such as clay - can be inspected successfully by appropriate Signal Processing
- Soil "clutter" can be significantly minimized by a Data Preprocessing step using a Combination of Signal Processing Algorithms to enhance the Signal/Noise Ratio.
- 2D "Virtual Trench" maps can be created from the detected roots along each line scanned
- Connectivity Algorithm has been developed to automatically connect detected roots on multiple scan lines to create a 3D Root Morphology Map ("Virtual Excavation")
- Root Surface Density map shows the overall layout and density
TreeRadar™ Root Mapping Procedure Download
Click the link below to download a copy of the TreeRadar™ Root Mapping Procedure..
TreeRadar™ Root Mapping Procedure (PDF)
![]()
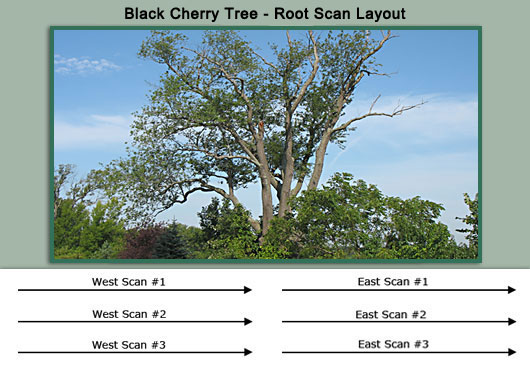
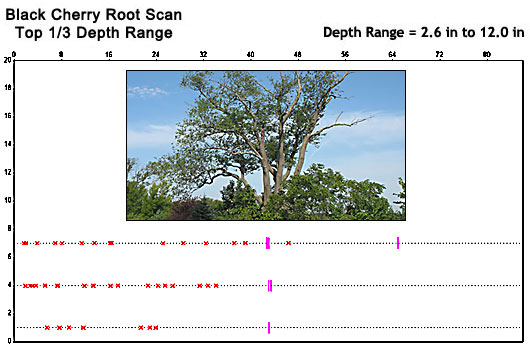
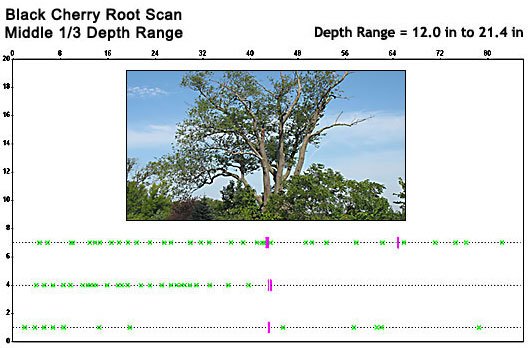
Root Inspection of a Distressed Black Cherry Tree
Root Inspection of a Distressed Black Cherry Tree
A multi-line root scan was conducted at the site of a Black Cherry tree located in the upper Midwest. The canopy on the east side of the tree showed considerable die-back and dead branches while the canopy on the west side looked healthy. A driveway had been installed on the east side of the tree five years earlier and the roots could have been injured during the construction work. So, a root inspection was requested to map the root layout and density on both sides of the tree.
Six line scans were conducted south of the tree with half on the west side of the tree and the other half on the east side. All scan lines were 40 ft long and proceeded from west to east. The west-east lines were contiguous pairs forming one long 80ft scan line. They were divided into two sectors of 40ft each to aid in the visualization of the final root maps.
The first pair of scan lines was conducted at a distance of 6.5ft south of the tree. The other two pairs of scan lines, parallel to the first pair, were conducted at 3ft increments as shown in the root scan layout schematic below.
The objectives of the non-invasive radar scans were to: (1) detect and create subsurface root maps of the structural roots showing the root layout and density as a function of distance from the Black Cherry tree and, (2) determine if root density was the same or different on either side of the tree since the east side of the canopy was in considerable decline compared to the west side.
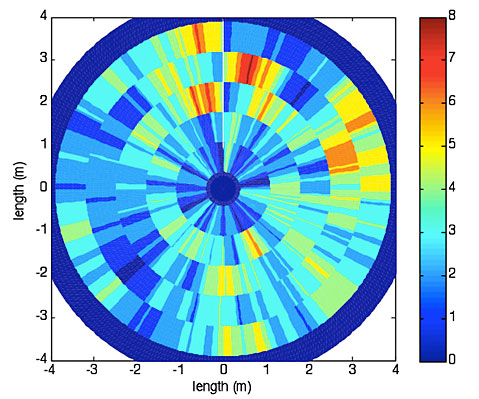
The inspections results are presented in the 3D top-down root map (“virtual excavation”) that gives the root layout and density, as a function of distance from the tree and depth. The inspection results show that:
1. The root density is considerably higher on the west side of the tree, which appears to be consistent with the canopy decline, and presence of dead wood, on the east side
2. The west side roots are found in two depth bands – one between 2in to 12in (color coded red) below the surface and the other between 12in to 18in (color coded green)
3. The few roots found on the east side were mainly at a depth of 24in
The root maps are consistent with the physical appearance of the tree, namely, die-back in the east side crown.
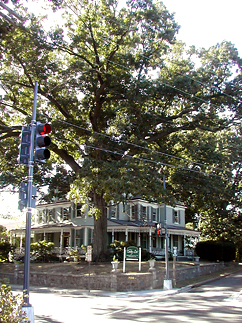
Tree Root Imaging at a Historical Site: In-Depth Assessment of Tree No. 1 – the
Copper Beech Tree
Background: A mature Copper Beech tree is located in a prominent position at a historical site in the United Kingdom that is known for its archaeological significance and is a major tourist attraction. The tree is of significant amenity value in this public place. It is also very close to a proposed development and is likely to be impacted by the construction of planned new structures. Its presence is also a major constraint to archaeological excavations and construction work. In order to gain in-depth information on this tree so that informed judgments could be made, several assessments were undertaken and reports prepared.
The following is excerpted from Treecare Consultants Ltd's report with their permission.
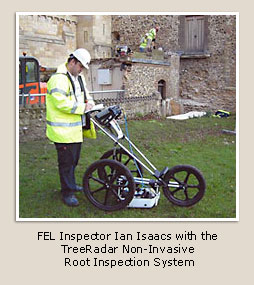 "One of the assessments was a tree root area inspection (February 2007) using the
TreeRadar non-invasive root inspection system. Due to the complex nature of the
landscape around the tree, it was deemed unlikely that the tree’s root morphology would
be typical. This landscape includes underground archaeology, a sunken retaining wall to
the north and sunken footpath to the west. To determine the actual tree morphology so
that the real impacts on the tree could be more accurately assessed, a non-invasive scan
was undertaken using the TreeRadar system. The inspection was conducted by Fujikura
Europe Ltd (FEL) personnel under the supervision of Treecare Consultants Ltd who were the arboricultural consultants.
"One of the assessments was a tree root area inspection (February 2007) using the
TreeRadar non-invasive root inspection system. Due to the complex nature of the
landscape around the tree, it was deemed unlikely that the tree’s root morphology would
be typical. This landscape includes underground archaeology, a sunken retaining wall to
the north and sunken footpath to the west. To determine the actual tree morphology so
that the real impacts on the tree could be more accurately assessed, a non-invasive scan
was undertaken using the TreeRadar system. The inspection was conducted by Fujikura
Europe Ltd (FEL) personnel under the supervision of Treecare Consultants Ltd who were the arboricultural consultants.
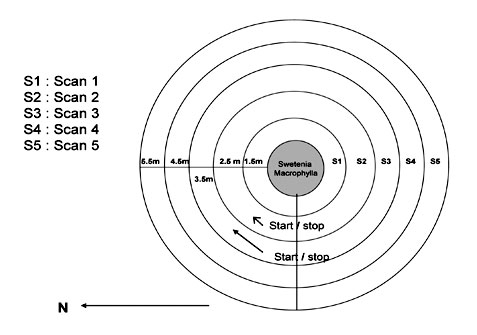
A number of different types of scans were conducted: (1) 4 semi-circular scans around the
tree on the grassy slope, (2) 5 parallel line scans over presumed archaeology under grass
surface to the west of the tree, and (3) 1 line scan over tarmac to the south of the tree.
The data from these 10 scans was sent to America to be analyzed and a report was produced. This information was translated by Treecare Consultants Ltd to produce a tree root morphology plan. This plan shows the likely position and distribution of the assessed
roots. The roots are likely to extend well beyond the points of assessment particularly in
the open ground to the south and west.
Results: The root scan detects tree roots down to a minimum of 1.3cm (0.5in) diameter, but does not (presently) differentiate between various root diameters. Tree roots will increase in diameter close to the tree stem. The main findings were:
a) Tree roots extended to a maximum depth of 55cm (22in) below the ground surface.
b) The majority of the roots occurred in the middle horizon between 27cm (11in) and 50cm
(20in) below ground level. There were very few roots below 50cm (20in) and these
appear to be “droppers” or anchor roots.
c) A moderate amount of roots appear to be surface roots occurring in the top soil horizon
to a depth of 27cm (11in).
d) Tree root density was notably thicker in the open grass area to the west and south in
comparison to the east. Tree roots in this area are likely to be restricted by the
underground archaeology such as subterranean walls.
e) A single scan was undertaken to the north adjacent to the sunken retaining wall.
Several roots were found in this area. It has not been verified at this stage whether
these are tree roots or remnants of roots of the previously removed shrubs.
Tree Morphology Plan View. Using the above results and the 2D planar root maps (“virtual trench”) and 3D top-down root map (“virtual excavation”) created from the 10 root scans and provided in TreeRadar’s report, Treecare Consultants Ltd personnel constructed a tree morphology figure that combined the results of the semi-circular and line scans into one, overall top-down plan view as shown below. The roots are color coded as per the legend in the figure to show their depths. (Figure 1)
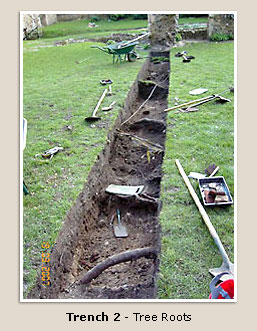
Root Inspection Trenches. Two root inspection trenches were dug to check the accuracy of the predicted root layout and density based on the TreeRadar non-invasive inspection as shown in Figure 2.
Figure 1: 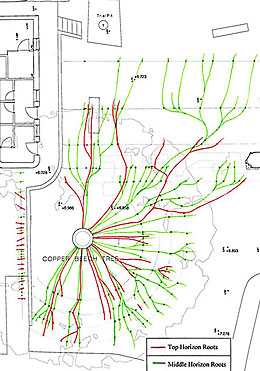 Tree Morphology Plan View Root Detections (dots) Connected to Display Root Layout and Density (Click image for larger view) |
Figure 2: 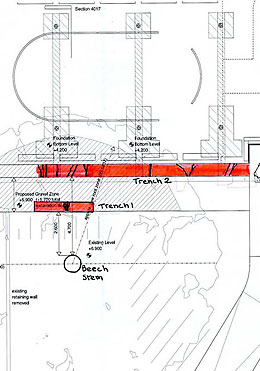 Inspection Trenches (Click image for larger view) |
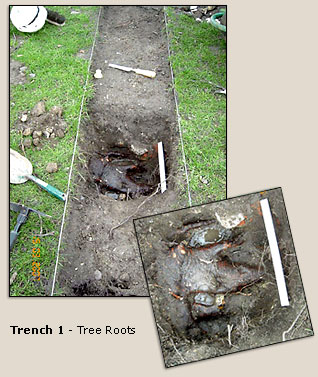 The first trench, Trench 1, was excavated at a distance of 2.6m (8.5ft) from the tree stem
to the east. This is in-line with the proposed slope and French drain adjacent to the outer
wall of the structure. Tree roots were located at a depth of 20cm (8in) and were found to
be closely positioned, large diameter, structural roots with a maximum diameter of 17cm (7in).
The first trench, Trench 1, was excavated at a distance of 2.6m (8.5ft) from the tree stem
to the east. This is in-line with the proposed slope and French drain adjacent to the outer
wall of the structure. Tree roots were located at a depth of 20cm (8in) and were found to
be closely positioned, large diameter, structural roots with a maximum diameter of 17cm (7in).
The excavations verified the results of the previous TreeRadar scans and confirmed that tree roots were being restricted by the underground archaeology."
Comparison of Predicted Root Location and Depth with Excavated Data
Comparison of Predicted Root Location and Depth with Excavated Data
Sacramento, California (September 2005)
Five Line Scans conducted, each 10ft (3m) long 2D Planar "Virtual Trenches"
Sycamore (6ft dbh) with Two Large Cavities at High Elevations next to Playground
 Sycamore (6ft dbh) with Two Large Cavities at High Elevations next to Playground
A TRU survey was performed at Rock Creek Park in Washington, DC on a Sycamore located at a playground.
The tree was scanned at six elevations – 7-ft, 6-ft, 5-ft, 4-ft, 3-ft, 2-ft. A complete 360-degree circumferential TRU radar scan was performed for each elevation. The radar waveform data were automatically digitized at 0.2-in (5-mm) increments throughout the entire circumference, which produced a very high-resolution internal cross-sectional image.
This tree has two large cavities on opposite sides of the trunk as shown in the pictures on the cover page. It was anticipated that the decay column would be advancing down through trunk from elevation of these two wounds and it was of interest to track the decay column to see how low it has progressed.
Trunk & Root Scans on a Historic Oak Tree in Washington, DC
Trunk & Root Scans on a Historic Oak Tree in Washington, DC
 Results of Trunk Scans at Four Elevations:
“These results suggest that the decay becomes progressively more extensive near the base of the tree. The hollow sounding area, between 4:00 and 9:00 o'clock for all elevations, appears to be near-surface decay with the RSW between 0 to 3 inches.”
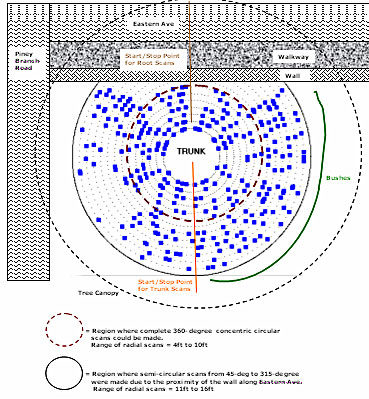
Results of Root Scans around the Trunk:
“The root density is fairly sparse in the back of the tree facing the wall. This is a down-hill slope and represents the compression side of the tree. This is also where trunk decay was found to be the most extensive and where the trunk vertical crack exists.”
Conclusions:
“This tree represents a potential risk hazard and should now be examined by a certified arborist to make a final assessment.”
Based on examination by 3 Independent Consulting Arborists + TreeRadar report, 200+ year old Oak was felled on December 1, 2005
Cross-Sections of each Elevation Scanned showing Progressively Increased
Decay as Base is Approached - Base was completely rotted as were the roots
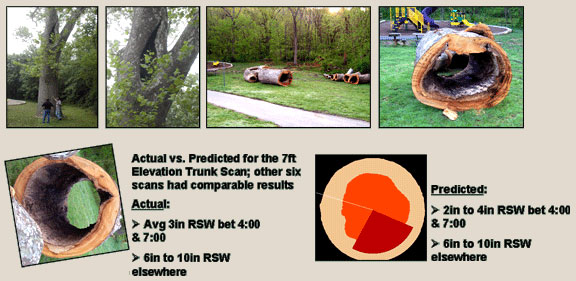
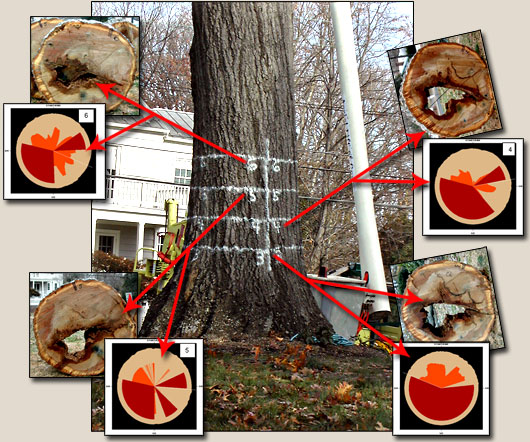
Comparison of Actual vs. Predicted Cross-Sections
Top-Down 3D Plan View of Root Layout and Density
Blue Dots indicate detected Roots along a given Circular Scan Line
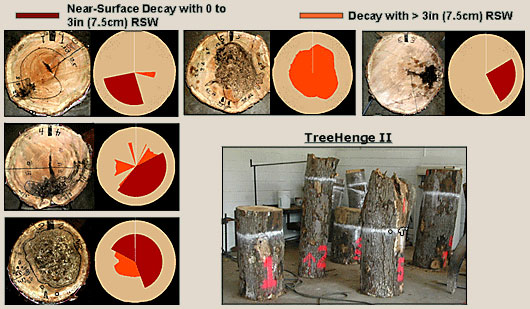
True vs. Predicted Trunk Cross-Sections for Five Different Decayed Hardwoods
True vs. Predicted Trunk Cross-Sections for Five Different
Decayed Hardwoods - Five different hardwoods, each with suspected or confirmed decay and scheduled for removal, were scanned by TRU. The true vs. predicted cross-sections at the dbh elevation are shown in the figure. All five trees were decayed at this elevation, including four with near-surface decay.
Brochure
The TreeRadar brochure (pdf) presents an overview of the TRU system and software.

Saving Trees,
One at a Time.
Saving trees requires knowledge of their internal trunk and subsurface root structure. Many trees with decay can still survive well for many years. But only if the extent of the decay is known and found to be within acceptable safety bounds. TreeRadar’s advanced technology provides the information to help certified arborists make this risk assessment.