Trunk Inspection
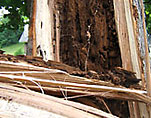
 Tree care specialists presently assess tree health by visual examination and with the use of invasive tools such as borers and drills. Visual examination is conducted by a certified arborist whose assessment, based on experience, includes the observance of red flag indicators such as wounds to the trunk and limbs (from construction and improper pruning), size and fullness of the crown (upper branches), degree of trunk tilt, and ground obstructions such as sidewalks, roadbeds, presence of “fruiting bodies” (mushrooms), external fungal bodies and nearby homes.
 The TRU radar imaging system presents the tree diagnostician with a dramatically enhanced tool to assess a tree's health. A high-resolution image (an "MRI for trees") is easily created by a technician and provides 100% coverage of the tree trunk.
Additionally, a quantitative table of the amount of remaining solid wood is also generated. This is obtained completely non-invasively and is no more time consuming or harmful to the tree than walking around it while rubbing a hand against the bark.
Advantages of TRU System for Trunk Inspection
- Non-Invasive
- Portable, via battery supply
- Minimal set-up, easy-to-use
- Rapid scan - less 1 minute per horizontal circumferential section
- High-Resolution (0.2 inch (5 mm) increments), 360° cross-sectional image of internal trunk at each horizontal section ("Virtual Saw Cut ")
- Quantitative table of remaining solid wood across entire circumference
- Risk Assessment determination (supplied by certified Arborist)
- Usable at high elevations via bucket truck or climber
- Easy to use
- Accurate and fast
Trunk Inspection Procedure
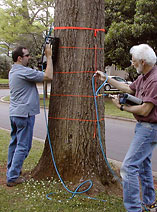 A tree trunk can be scanned at multiple elevations - typically 6 ft, 5 ft, 4 ft, 3 ft,
and 2 ft
- in under 30 minutes.
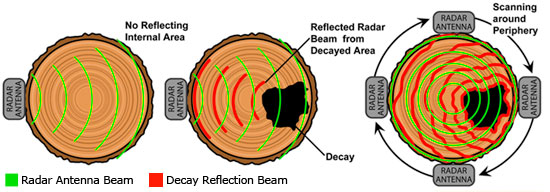
A technician holds the antenna, with an attached spring-loaded "survey" wheel, against the tree at a selected elevation and walks around the tree at a normal pace. The field data acquisition computer automatically generates a radar waveform for every 0.2 inch (5 mm) of circumference traversed (as reported automatically to the computer by the survey wheel). A complete 360-degree pass around the tree produces hundreds of waveforms, one for every 0.2 inch (5 mm), that are stored in the field computer.
The technician thus creates a "radargram" - an ensemble of radar reflected waveforms - in a completely automated manner. The technician's only task is to hold the antenna against the bark while walking around the tree; the field computer does the pulsing and recording automatically.
 The technician can record other radargrams by making additional circumferential passes at different elevations. These multi-elevation scans are important for determining the decay profile.
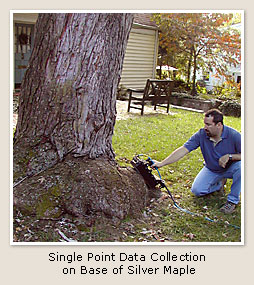
Trunks can also be inspected at the lowest elevation where bumpy conditions or the base geometry prevent scans from being done.
Here the system is used in the "Point" mode. The antenna is held at one location - one point - and a single waveform is recorded at this point by pressing a button. The antenna can be placed at any desired point and single waveforms recorded at each point. Decay detection is performed at each point just as if a scan had been done.
The Point Mode makes TRU a "Virtual Drill" with the advantage that multiple "drill holes" can be made with this non-invasive "drill".
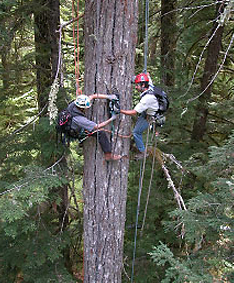
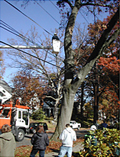
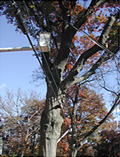
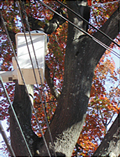
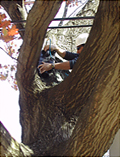
Climbers using TRU to perform complete 360-deg circumferential scans of large conifers at high elevations.
The two climbers are shown handing off the antenna from one to another to perform the complete scan.
The field computer is being operated by a third individual in a gondola of a 285 ft (87 m) tall crane, located 20 ft (6 m) from the climbers, with a 100 ft (30 m) cable attaching the field computer to the scanning radar antenna.
Douglas Fir, 210 ft (64 m) tall, scanned from top to bottom at 20 different elevations.
TRU Scan Data Results
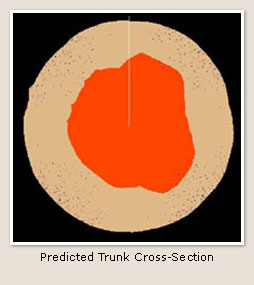
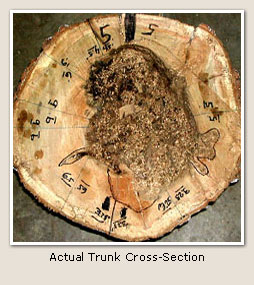
It takes only one minute to create and record each scan. After the data have been recorded, the post-processing data-analysis software module, TBA, is used to read the radargram and to create a cross-section image that represents the internal trunk structure for each elevation scanned. A plot, showing a 360-degree plot of the thickness of the remaining solid wood is printed for each elevation scanned.
The customer is provided with a graphical report that shows:
- Cross-sectional image at each elevation scanned
- Plot of remaining solid wood at each elevation scanned
- Comments from the TreeRadar analyst regarding interpretation of the images
These results can then be used by a certified arborist, along with other traditional criteria, to assess the risk for a tree whose health and structural integrity may have been compromised by decay and loss of solid wood.
 |
 |
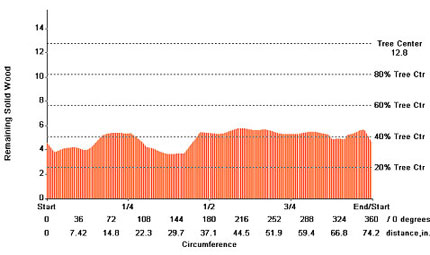
Predicted Remaining Solid Wood Thickness Around Entire Trunk Circumference

Saving Trees,
One at a Time.
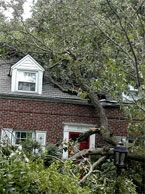
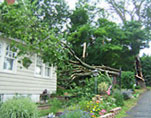
Saving trees requires knowledge of their internal trunk and subsurface root structure. Many trees with decay can still survive well for many years. But only if the extent of the decay is known and found to be within acceptable safety bounds. TreeRadar’s advanced technology provides the information to help certified arborists make this risk assessment.
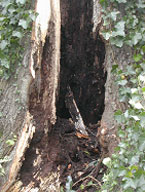
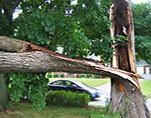
Trunk Decay
TRU™ at High Elevations